Global Olive Production
by Country
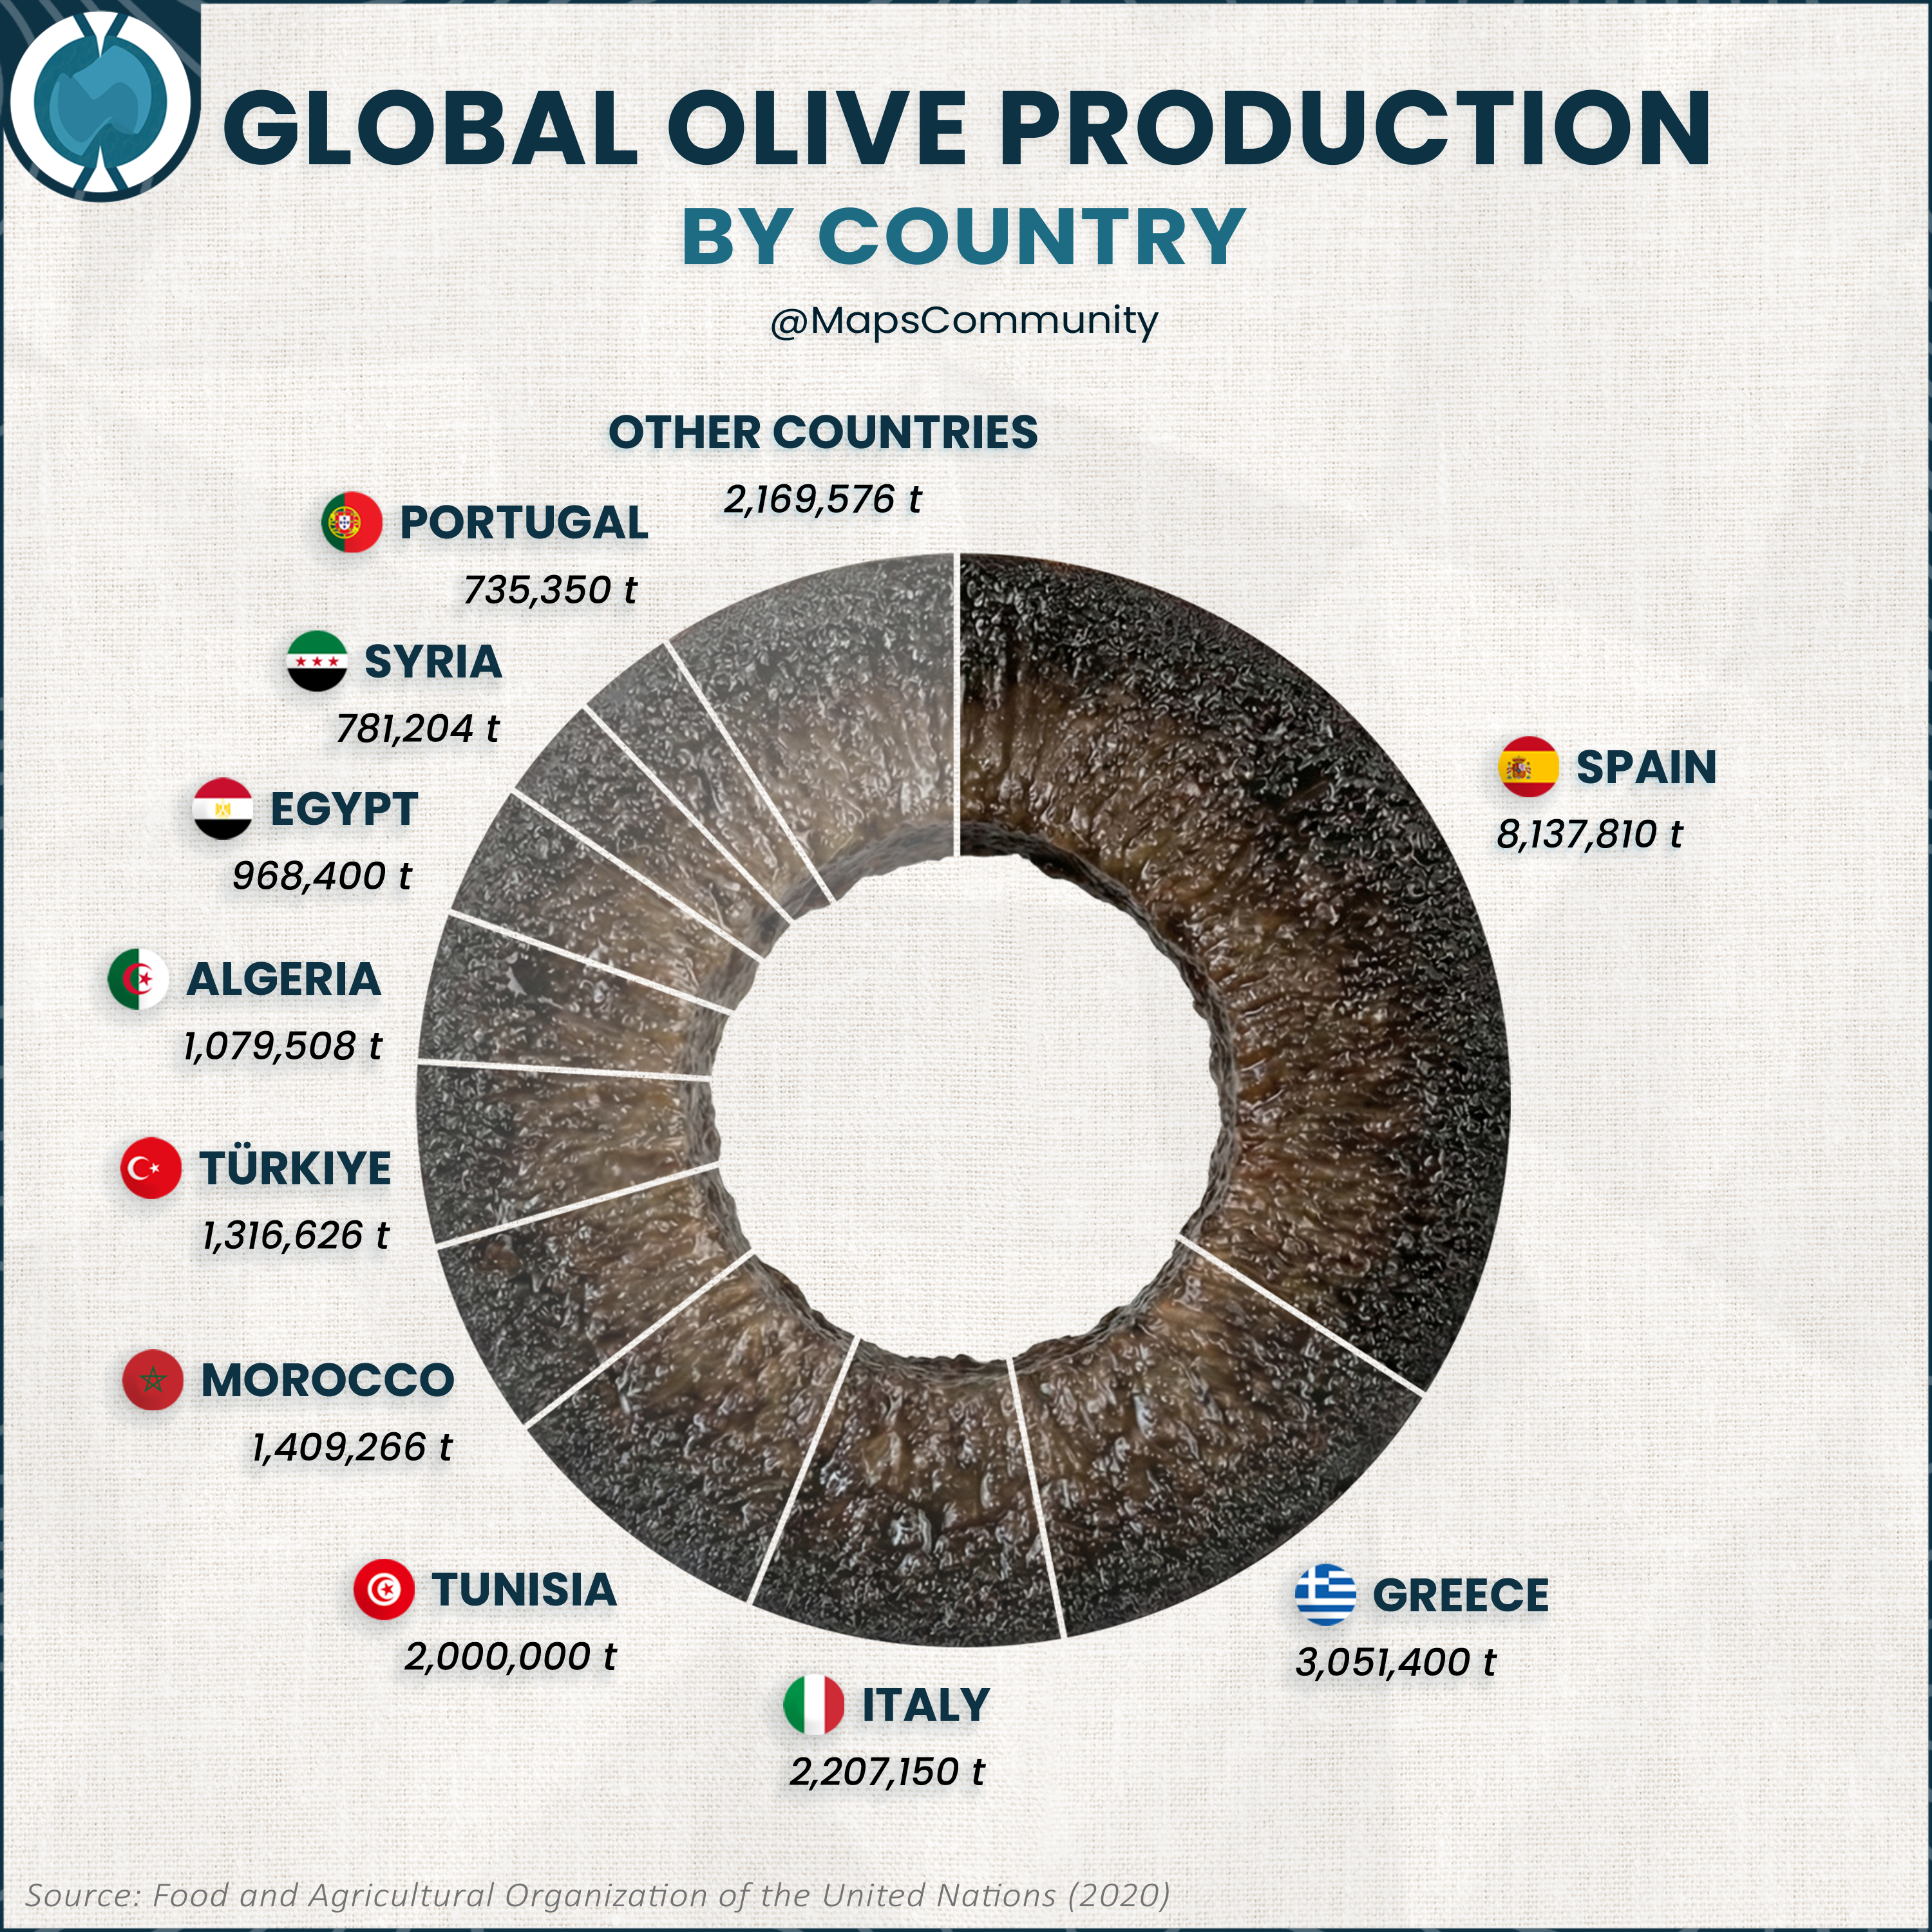
Spanish agricultural output overwhelmingly anchors the global olive market, manifesting a production volume of 8,137,810 tonnes that surpasses the combined yields of the next three top producers. This stratification is evident as Greece and Italy follow with 3,051,400 tonnes and 2,207,150 tonnes respectively, underscoring a heavy concentration of cultivation within the northern Mediterranean. Tunisia and Morocco maintain this regional hegemony with substantial contributions of 2,000,000 tonnes and 1,409,266 tonnes, while Türkiye provides 1,316,626 tonnes. Production figures further delineate the environmental specificity of the crop, with Algeria contributing 1,079,508 tonnes and Egypt yielding 968,400 tonnes. Syria and Portugal add 781,204 tonnes and 735,350 tonnes to the supply chain, leaving a diffuse aggregate of 2,169,576 tonnes distributed among the remaining global territories. Data sourced from the Food and Agricultural Organization (2020) elucidates that the vast majority of the world's olive resources originate from this distinct climatic belt.
Country and Production Data
|
Country
|
Production (tonnes)
|
|---|---|
| Spain | 8137810 |
| Greece | 3051400 |
| Italy | 2207150 |
| Tunisia | 2000000 |
| Morocco | 1409266 |
| Türkiye | 1316626 |
| Algeria | 1079508 |
| Egypt | 968400 |
| Syria | 781204 |
| Portugal | 735350 |
| Saudi Arabia | 364546 |
| Argentina | 321000 |
| Peru | 174316 |
| Libya | 172520 |
| Jordan | 169265 |
| Chile | 137436 |
| Lebanon | 136380 |
| Albania | 131971 |
| Iran | 102087 |
| Israel | 83000 |
| Palestine | 76630 |
| United States of America | 61420 |
| Australia | 48204 |
| Iraq | 33912 |
| Croatia | 33230 |
| France | 27690 |
| Mexico | 26762 |
| Cyprus | 22010 |
| North Macedonia | 11745 |
| El Salvador | 11426 |
| Afghanistan | 8021 |
| Slovenia | 3100 |
| Brazil | 2651 |
| China | 2609 |
| Taiwan | 2609 |
| Uruguay | 1931 |
| Bosnia and Herzegovina | 985 |
| Azerbaijan | 969 |
| Kuwait | 740 |
| Montenegro | 295 |
| Uzbekistan | 116 |