Mumbai Neighbourhoods
by Population Density
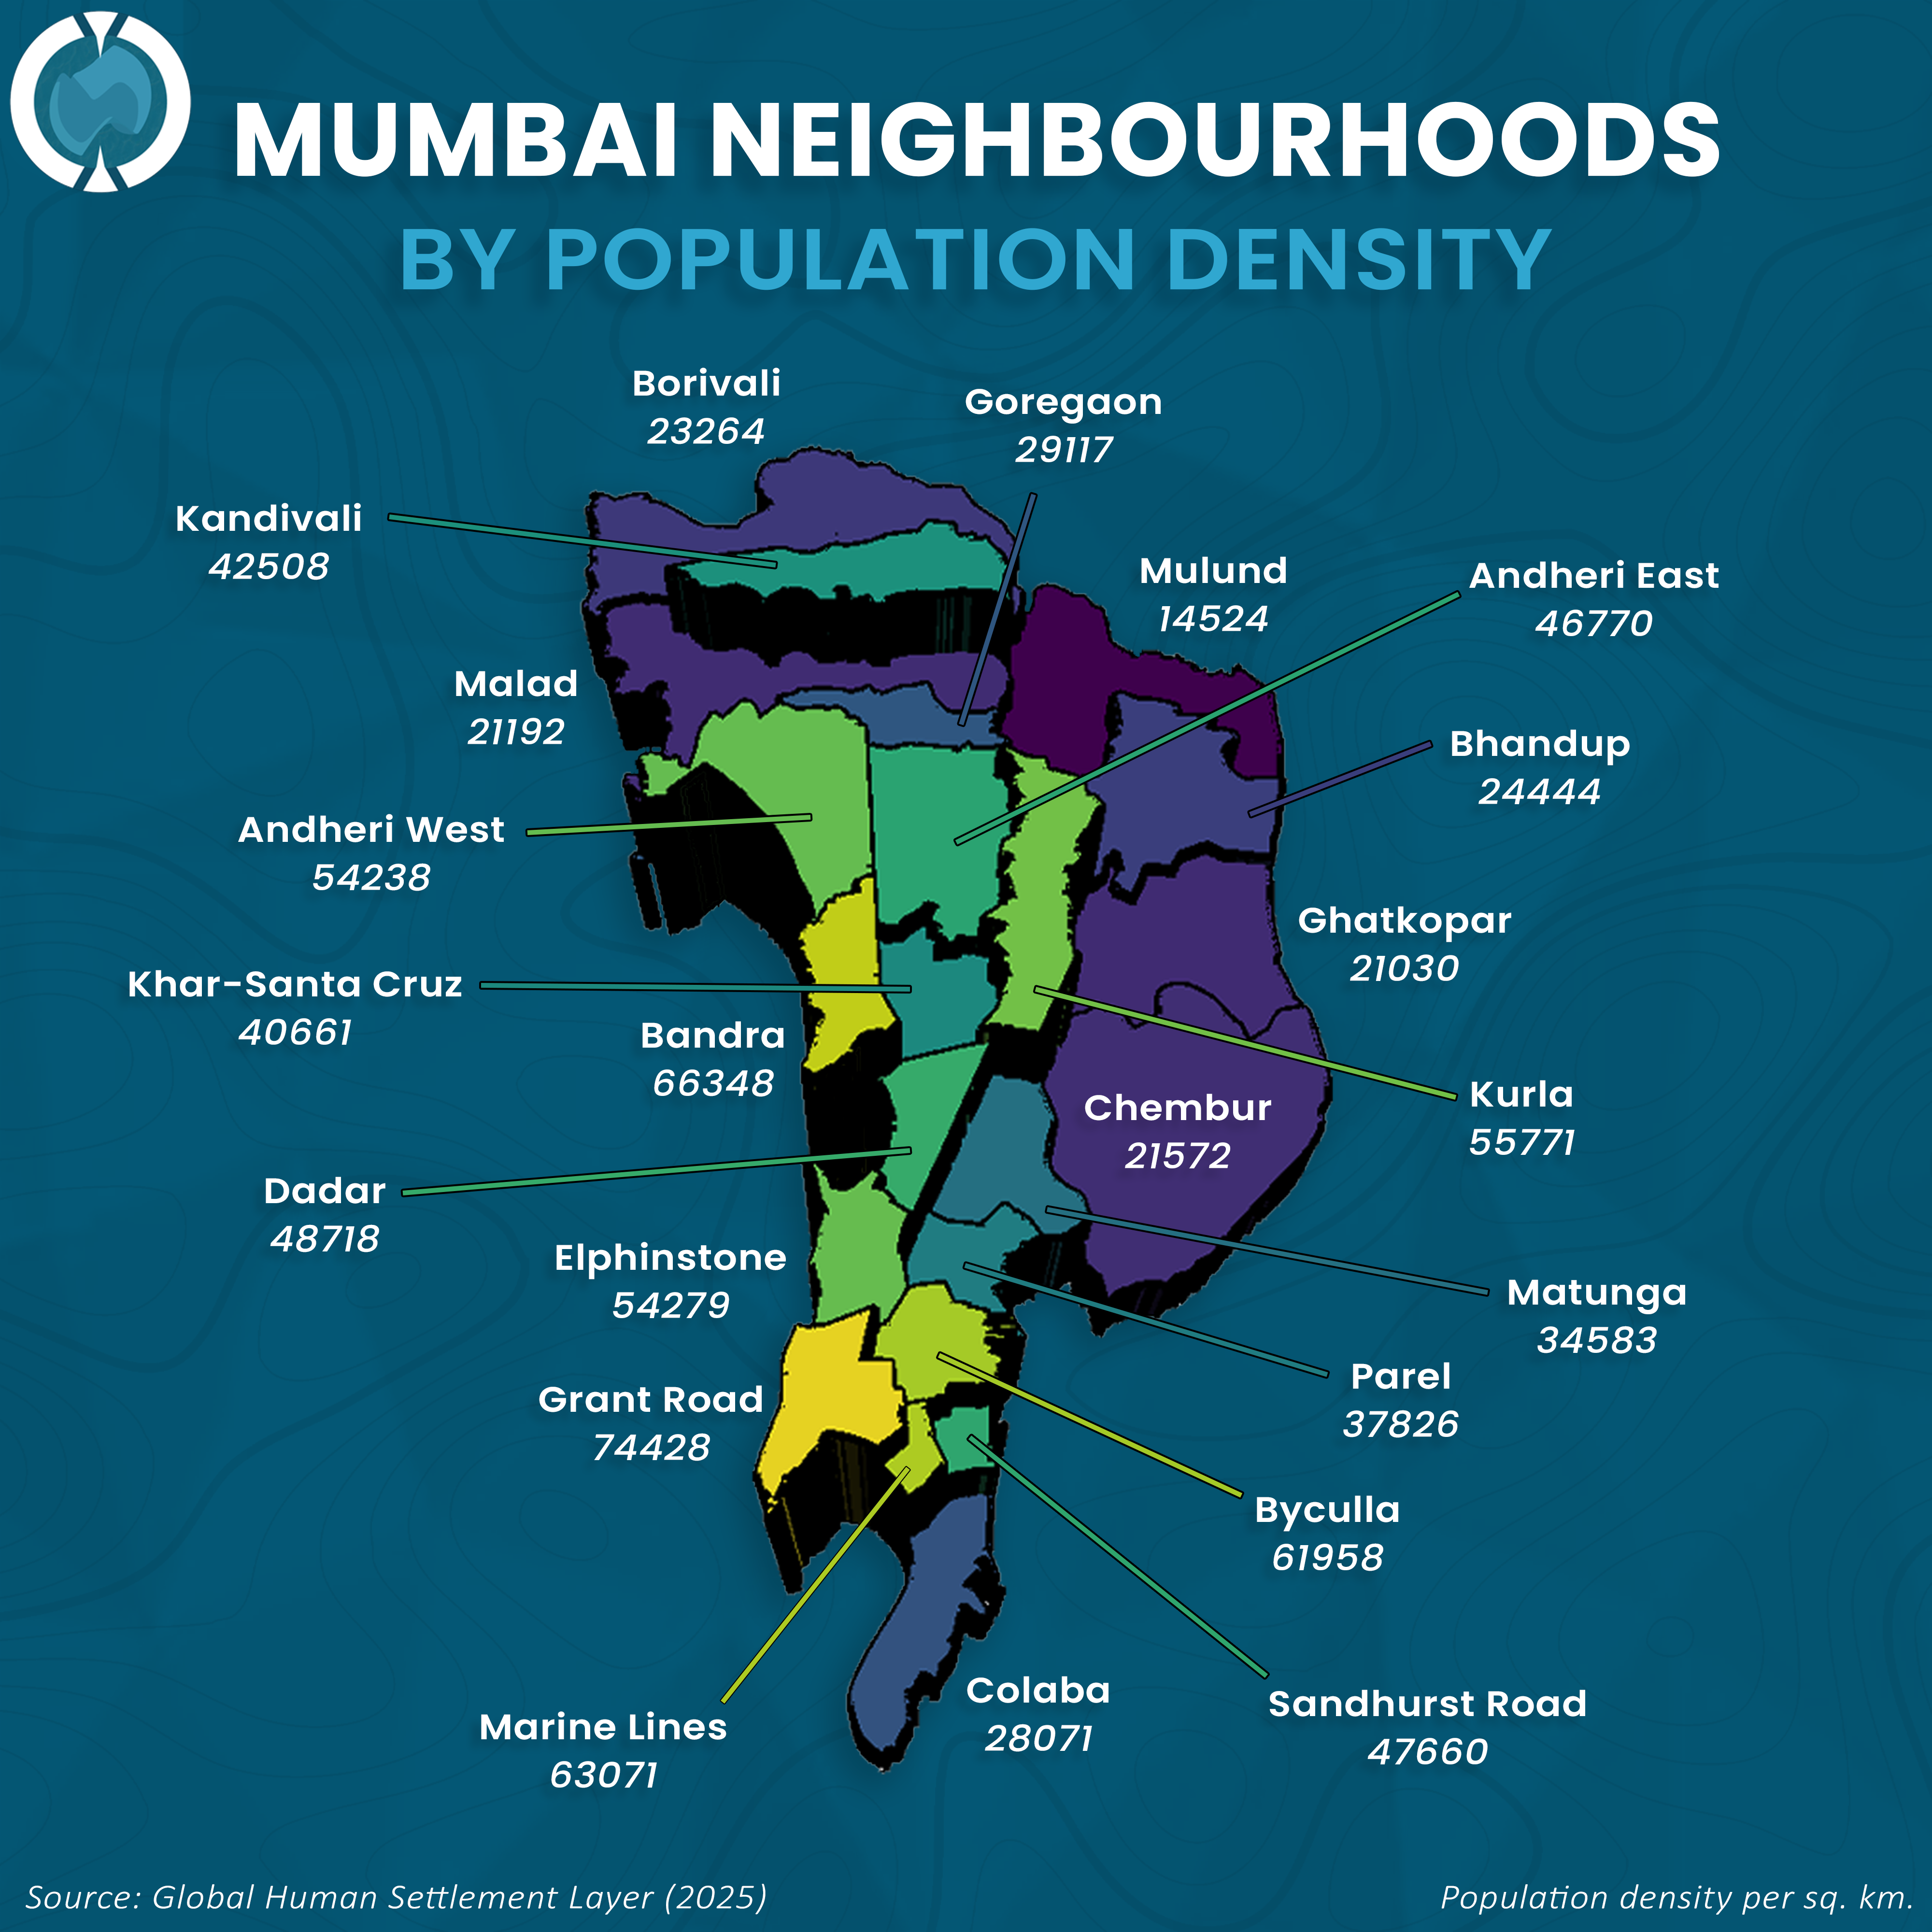
Demographic density in Mumbai manifests a stark north-south dichotomy, with the highest levels of human aggregation concentrated in the southern peninsula. Grant Road stands as the primary center of consolidation with 74,428 people per sq. km, followed closely by Bandra at 66,348 and Marine Lines at 63,071. These high-intensity zones contrast sharply with the northern peripheries, where Borivali and Goregaon record significantly lower figures of 23,264 and 29,117 respectively.
Central and eastern corridors reveal a more heterogeneous distribution of residents. Kurla maintains a dense profile of 55,771 residents per sq. km, whereas Mulund represents a relative statistical trough with a sparse distribution of only 14,524. This stratification continues through the western suburbs, where Andheri West at 54,238 and Andheri East at 46,770 underscore a high level of residential saturation compared to the more diffuse 21,192 recorded in Malad. The Global Human Settlement Layer data from 2025 thus elucidates a trend of extreme urban compression within the city's established southern and central hubs.
Mumbai Neighbourhoods by Population Density
|
Neighbourhood
|
Population Density (per sq. km)
|
|---|---|
| Grant Road | 74428 |
| Bandra | 66348 |
| Marine Lines | 63071 |
| Byculla | 61958 |
| Kurla | 55771 |
| Elphinstone | 54279 |
| Andheri West | 54238 |
| Dadar | 48718 |
| Sandhurst Road | 47660 |
| Andheri East | 46770 |
| Kandivali | 42508 |
| Khar-Santa Cruz | 40661 |
| Parel | 37826 |
| Matunga | 34583 |
| Goregaon | 29117 |
| Colaba | 28071 |
| Bhandup | 24444 |
| Borivali | 23264 |
| Chembur | 21572 |
| Malad | 21192 |
| Ghatkopar | 21030 |
| Mulund | 14524 |